Objective
The objective of this experiment is to determine the buckling loads for solid and hollow with various lengths when subjected to axial compression forces.
Introduction
A column with an applied force will
eventually deform as the force increases. Several factors influence the critical buckling load: length of the column, support conditions, the location
of the load relative to centroid of the axis and the shape of the cross section. The deflection of an elastic column is given by:
Where:
M(x) is bending moment;
E is the modulus of elasticity;
I is the moment of inertia of the cross section;
x is the distance of a point on the beam;
y is the deflection;
For the situation when the two ends of the column are pinned, we assume that the load is centric and the column only deforms elastically, we have Euler’s formula which calculates the theoretical critical buckling load:
Where:
Pcr is the critical buckling load;
L is the column’s effective length;
The following formula allows computing the critical normal stress:
Where:
r is the radius of gyration: ;
A is the cross sectional area;
λ is the slenderness ratio( )
When the support conditions are different, the effective length of the column (Le) should be used in the equations above to replace the value L. The effective length is determined by multiplying the column length L by the effective length factor K. For situation when where there is one fixed end, one free end, K=2. When one end is fixed, the other is pinned, K=. When both ends are fixed, K=0.5.
(source: lab manual)
In reality, the assumptions that are made for the Euler’s formula are usually not met. Experimental failure loads are usually lower than the theoretical value. Here we use design formulas for alloy 6061-T6, which is the material of the specimen in this lab
Equipment and specimens
1. Compression testing machine;
2. Load measuring devices;
3. Vernier calliper;
4. Aluminum tubes and rods with different lengths: 225mm, 125mm and 75 mm
Procedure
1. Measure the inner diameter and outer diameter of each specimen.
2. Start the experiment with the 225mm specimen first. Perform individual tests with each specimen for the following three conditions: both ends fixed, one end fixed with one pinned, and both ends pinned.
3. Apply load and gradually by increase the compressive force until an obvious deformation occur. Record the value of load.
4. Perform experiments on 125mm and 75mm specimen only under the condition when both ends are fixed
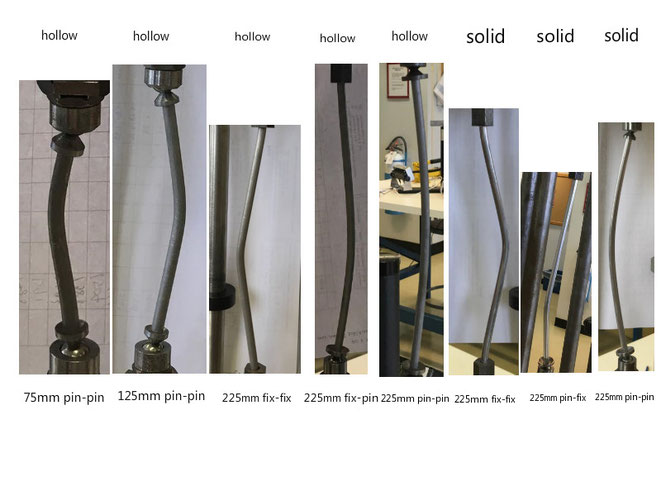
5. Sketch/take a picture of the mode of failure for each sample.
Analysis of the results
Sample calculations:
1.Cross sectional area:
For hollow column with 225 mm length and pin-fixed end:
For solid column with 225 mm length and pin-fixed end:
Moment of inertia:
For hollow column with 225 mm length and pin-fixed end:
For solid column with 225 mm length and pin-fixed end:
Radius of gyration:
For hollow column with 225 mm length and pin-fixed end:
2.
Effective length:
For hollow column with 225 mm length and pin-fixed end:
Critical load:
E=70*103 MPa
For hollow column with 225 mm length and pin-fixed end:
3. Experimental Critical Stress:
For hollow column with 225 mm length and pin-fixed end:
Slenderness ratio:
For hollow column with 225 mm length and pin-fixed end:
4. Theoretical Critical Stress:
For hollow column with 225 mm length and pin-fixed end:
Report
1.
|
Type of column |
Column length, L(mm) |
End condition |
Experimental critical load, Pcr (N) |
Experimental critical stress, σcr (MPa) |
|
|
Hollow |
75 |
pin-pin |
3796 |
249.9 |
|
|
125 |
pin-pin |
3210 |
213.29 |
||
|
225 |
pin-pin |
1480 |
97.69 |
||
|
225 |
pin-fixed |
1291 |
85.78 |
||
|
225 |
fixed-fixed |
2103 |
140.86 |
||
|
Solid |
225 |
pin-pin |
1585 |
51.01 |
|
|
225 |
pin-fixed |
1504 |
47.94 |
||
|
225 |
fixed-fixed |
2664 |
84.92 |
2&3
allowable stress:
for λ< 9.5: (1)
for 9.5 < λ < 66: (2)
for λ > 66: (3)
sample calculations :
For hollow column with 225 mm length and fixed-fixed end:
For solid column with 225 mm length and pin-fixed end:
Discussion
1. Comparing the theoretical and the experimental value of the critical stress we notice that their values are different. Many factors may cause these discrepancies. For example, the load was not gradually applied, the load was not perfectly centric, the material does not have an exact elastic modulus of 70Gpa, and the shape of the cross section is not perfectly uniform. Comparing the values, we notice that some experimental stress values are lower than the theoretical ones, others are higher.
2. Comparing values on the graph, we notice that the allowable stresses values recommended by the aluminum association are lower than both theoretical and experimental values. This is the expected result because the allowable stress should always be less than the stress at failure condition
3. Buckling strength of real columns is affected by many factors, for example, the radius of the cross section, the shape of the cross section, the location of the load relative to the central axis of the column, the actual elastic modulus of the tested material.
4.
The buckling load is proportional to I given other values are the same for both solid and tube specimens. Taking a solid bar (d=2mm) and a circular tube (dout=mm, din=1mm) as an example, they both have the same Area.
For circular tube:
For solid bar:
Itube is greater than Ibar, so the circular tube has a higher buckling load.
Conclusion
In this experiment, we have learned that buckling load depends on many factors such length of the column, the dimension of cross-section area, elastic modulus of the column and the support conditions. We have found that the experimental values are different that the theoretical values, and both of them are greater than the allowable stress values.
|
Type of column |
Column length, L(mm) |
End condition |
Effective length factor, k |
Effective length |
Inner diameter (mm) |
Outer diameter (mm) |
x-section-nal area |
Moment of inertia (mm4) |
Radius of gyration (mm) |
Slender-ness ratio, λ |
Allowable stress, σall (MPa) |
Theoretical critical load, Pcr (N) |
Theoretical critical stress, σcr (MPa) |
Experimental critical load, Pcr (N) |
Experimental critical stress, σcr (MPa) |
|
|
Hollow |
75 |
pin-pin |
1 |
75 |
4.58 |
6.35 |
15.19 |
58.21 |
1.96 |
38.27 |
105.78 |
7149.45 |
471.72 |
3796 |
249.9 |
|
|
125 |
pin-pin |
1 |
125 |
4.60 |
6.35 |
15.05 |
57.83 |
1.96 |
63.78 |
83.64 |
2557.00 |
169.84 |
3210 |
213.29 |
||
|
225 |
pin-pin |
1 |
225 |
4.60 |
6.36 |
15.15 |
58.33 |
1.96 |
114.80 |
26.63 |
796.02 |
52.42 |
1480 |
97.69 |
||
|
225 |
pin-fixed |
0.707 |
159.08 |
4.60 |
6.35 |
15.05 |
57.33 |
1.95 |
81.58 |
52.71 |
1565.12 |
103.81 |
1291 |
85.78 |
||
|
225 |
fixed-fixed |
0.5 |
112.5 |
4.63 |
6.36 |
14.93 |
57.76 |
1.97 |
57.11 |
89.43 |
3285.62 |
211.82 |
2103 |
140.86 |
||
|
Solid |
225 |
pin-pin |
1 |
225 |
6.29 |
31.07 |
76.84 |
1.57 |
143.31 |
17.09 |
1048.62 |
33.64 |
1585 |
51.01 |
||
|
225 |
pin-fixed |
0.707 |
159.08 |
6.32 |
31.37 |
78.31 |
1.58 |
100.68 |
34.63 |
2137.88 |
68.16 |
1504 |
47.94 |
|||
|
225 |
fixed-fixed |
0.5 |
112.5 |
6.32 |
31.37 |
78.31 |
1.58 |
71.20 |
69.24 |
4274.74 |
136.28 |
2664 |
84.92 |
|||
Write a comment